Updated (20/10/08)– removed IP addresses and other minor edits
Wow - great fun! I was dev lead on a Proof-of-Concept project for National Rail Enquiries (NRE) at the Microsoft Technology Centre (MTC) in Reading. Jason Webb (NRE) and I demonstrated it yesterday at a Microsoft TechNet event (I’ll post the webcast link when it’s available – Update: you can watch the presentation at http://technet.microsoft.com/en-gb/bb945096.aspx?id=396 – then click the link “National Rail Enquires” beneath the video) so it’s not confidential. 700 attendees (including Steve Ballmer – although he’d left before we were on) – there was no pressure!
At the MTC it was cool to work with a strong, focused team in such a productive environment. I decided to do a series of posts on what I found interesting about the experience. In this post I’ll give a short overview of the PoC’s output, with links to some screen captures. Then I’ll dive into some detail about how we used graph theory to pull together some meaningful data.
In just 3 weeks we delivered 5 pieces:
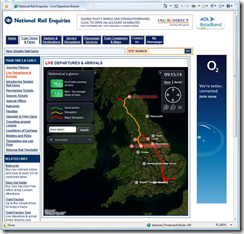 | 1. A Silverlight 2.0 (beta 2) web-site app for viewing Live Train Departures and Arrivals, using Silverlight Deep Zoom, Virtual Earth, and Deep Earth. | 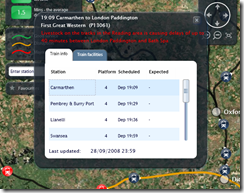 |
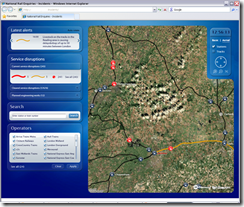 | 2. A variant of the above showing live Incidents and Disruptions - basically a concept application for rail staff. You can also see engineering works. 3. A Kiosk application that rotates around current incidents zooming in to show the location of the disruption. It also shows high-level rail network overview and performance statistics. | 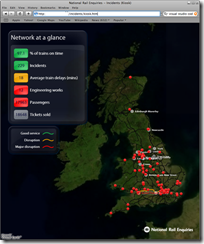 |
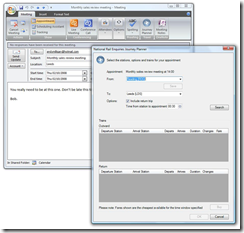 | 4. A Microsoft Office Outlook plug-in that helps you plan a journey for the selected calendar appointment. 5. And finally, a Windows Smart Phone application (see screen capture below) that shows live arrivals and departures for the selected leg of a journey. | 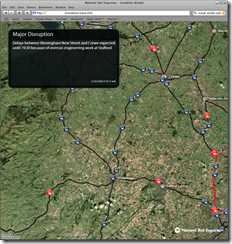 |
View Camtasia screen captures:
The outlook piece.
This is the Silverlight 2.0 web page app. (starts 00:30 seconds in)
This is the Windows Smart Phone application.
It's amazing what a great team can do in such a short time using today's extremely productive development tools!
So (every sentence at Microsoft starts with “So”) the team consisted of contingents from:
- Conchango: A user experience consultant (Tony Ward), a couple of great designers (Felix Corke and Hiia Immonen), a couple of C#/Silverlight developers (myself and David Wynne) and a data expert (Steve Wright);
- Microsoft: Project Manager (Andy Milligan), and Architect (Mark Bloodworth) and developers (Rob & Alex);
- National Rail Enquiries (including Ra Wilson).
Eleven of us in total, some for the full 3 weeks and some for less.
We faced some big challenges. One of the more significant of which was obtaining good data to play with. We wanted geographic data for the UK rail network. We already had the latitude and longitude of each station and some coordinates for tracks, but didn’t know how the stations connected up! Also the track data was really just a collection of short lines, each of which passed through a handful of coordinates. There was no routing information or relationship with any of the stations! So we had to imbue the data with some meaning.
Enter Graph Theory. It was straightforward to load all the little lines from the KML file into a graph using Jonathan 'Peli' de Halleux’s great library for C# called QuickGraph. Each coordinate became a vertex in the graph and the KML showed us, roughly, where the edges were. It didn’t work perfectly as there was no routing information – no data about what constitutes legal train movements. Also the data wasn’t particularly accurate so our graph ended up with little gaps where the vertices didn’t quite line up. But it was easy to find the closest of the 90,000 vertices to each of the 2,500 stations using WPF Points and Vectors:
private Vertex GetCloserVertex(Station station, Vertex vertex1, Vertex vertex2)
{
    Vector vector1 = station.Location - vertex1.Point;
    Vector vector2 = station.Location - vertex2.Point;
    return vector1.Length < vector2.Length ? vertex1 : vertex2;
}
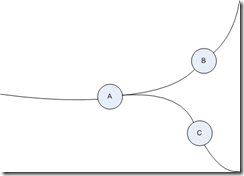 We had some timetable data that we used to extrapolate train routes and validate legal edges in our graph. One problem is trying to determine what constitutes a valid train move. In the diagram on the right it’s obvious to a human that whilst you can go from A to B and A to C you can’t go from B to C without changing trains. The graph however, doesn’t know anything about walking across to another platform to catch a different train!
Once we’d validated all the edges in the graph we could do all sorts of clever things like running algorithms to calculate the shortest route between any 2 stations! But the first thing we needed to do was validate the track “segments”. This was relatively straight forward using Peli’s excellent library, although there isn’t much documentation or many examples out there so I’ve attached a code snippet…
In the snippet we find each station’s nearest neighbour stations so that we can create track segments between them and exclude those that don’t correspond to legal train moves (from the timetable):
private void CreateFinalGraph()
{
    IEnumerable<Vertex> vertices = _graph.Vertices.Where(v => v.Station != null);
    foreach (var vertex in vertices)
    {
        var neighbours = new Dictionary<Vertex, List<Edge<Vertex>>>();
        var algorithm = new DijkstraShortestPathAlgorithm<Vertex, Edge<Vertex>>(_graph, edge => 1);
        var predecessors = new Dictionary<Vertex, Edge<Vertex>>();
        var observer = new VertexPredecessorRecorderObserver<Vertex, Edge<Vertex>>(predecessors);
        Vertex vertex1 = vertex;
        algorithm.DiscoverVertex
            += (sender, e) =>
                   {
                       if (e.Vertex.Station == null || e.Vertex.Station == vertex1.Station)
                           return;
                       neighbours.Add(e.Vertex, GetEdges(vertex1, e.Vertex, predecessors));
                       // found a neighbour so stop traversal beyond it
                       foreach (var edge in _graph.OutEdges(e.Vertex))
                       {
                           if (edge.Target != vertex1)
                               algorithm.VertexColors[edge.Target] = GraphColor.Black;
                       }
                   };
        using (ObserverScope.Create(algorithm, observer))
            algorithm.Compute(vertex);
        foreach (var neighbour in neighbours)
        {
            var segment = new Segment(vertex.Station, neighbour.Key.Station,
                                      GetPoints(neighbour.Value));
            bool isLegal = !vertex.Station.IsMissing &&
                           SegmentLoader.ValidSegments[vertex.Station.Crs]
                               .Contains(neighbour.Key.Station.Crs);
            if (isLegal)
                _finalGraph.AddVerticesAndEdge(segment);
        }
    }
}

private static Point[] GetPoints(IEnumerable<Edge<Vertex>> edges)
{
    var points = new List<Point>();
    foreach (var edge in edges)
    {
        if (points.Count == 0)
            points.Add(edge.Source.Point);
        points.Add(edge.Target.Point);
    }
    return points.ToArray();
}
private static List<Edge<Vertex>> GetEdges(
    Vertex from,
    Vertex to,
    IDictionary<Vertex, Edge<Vertex>> predecessors)
{
    Vertex current = to;
    var edges = new List<Edge<Vertex>>();
    while (current != from && predecessors.ContainsKey(current))
    {
        Edge<Vertex> predecessor = predecessors[current];
        edges.Add(predecessor);
        current = predecessor.Source;
    }
    edges.Reverse();
    return edges;
}
First we iterated around all the vertices (coordinates) in the graph that have a station associated with them and walked along the edges until we found another vertex with a station attached. That’s a neighbouring station so we can stop the algorithm traversing further in that direction by colouring all the successive vertices black (marks them as finished).
We attached an observer that records the predecessor edge for each vertex as we’re moving through the graph. Because we’re using a shortest path algorithm, each vertex has a leading edge that forms the last leg of the shortest path to that vertex. These predecessors are stored in the dictionary and are used to build a list of edges for each segment. Although we’re creating 2,500 graphs, QuickGraph algorithms run extremely fast and the whole thing is over in seconds.
Finally we check that the segment is valid against the timetable and store it in the database. The database is SQL Server 2008 and we’re storing all the coordinates as geo-spatial data using the new native GEOGRAPHY data type. This allows us to query, for example, all stations within a specified bounding area.
In the next posts I’ll cover some of the detail around the back-end and the Silverlight front-end, sharing some experiences with Deep Zoom and Deep Earth.


